Tradestation v2.0 Features
Tradestation v2.0 will carry a fresh look and feel, and a better user experience with the enhanced navigations for workspaces. The new features in the TradeStation desktop version are listed below:
Workspace
The Workspace allows you to view multiples features such as Market Watch, Charts, Condition Tracker, Scanner etc. You can be dock these features as you desire. All you need to do is its position and size as desired.
Workspace

You can create multiple workspaces and save them. These can be accessed from the Workspace Icon on the top bar. You can shuffle between your customized Workspaces. All the trades, orders and account-related reports can be accessed from across the screen available in the bottom menu. You can access reports like Order book, Trader Book, Positions, Portfolio, Holdings, Margins & Market Depth from here.
Multiple Workspace

Charts
We provide charts in all time frames, that are Daily, Weekly, Monthly, Yearly and intraday time frame (0, 1, 2, 3, 5, 10, 15, 30 etc. mins).
There are several types of study indicator that can be plotted on charts in any time frame. Open interest value is plotted on the chart for the top 2 calls and 2 put strike price having the highest percentage change in OI.
Accessibility to the charts is now made easier for the users as you can open up to 6 charts that are opened in the docked state and apply Candlestick patterns directly on charts.
Customize charts basis your needs. For e.g. customize the look and feel, show day separator, show grid lines, show news, show pivot lines. All of these can be customized from settings, which is available on the right click in the charts window.
Multiple charts on single screen

Mouse Trading on Charts can be toggled by clicking the mouse icon on the chart. It shows a crosshair with an orange line indicating the current price and moving the mouse changes the price. The order can be executed by clicking the left mouse button to buy and right mouse button to sell.
Strategy backtesting using charts: you can test your strategies and trade based on studies plotted on the chart with the strategy pro tool.
Mouse Trading on Charts

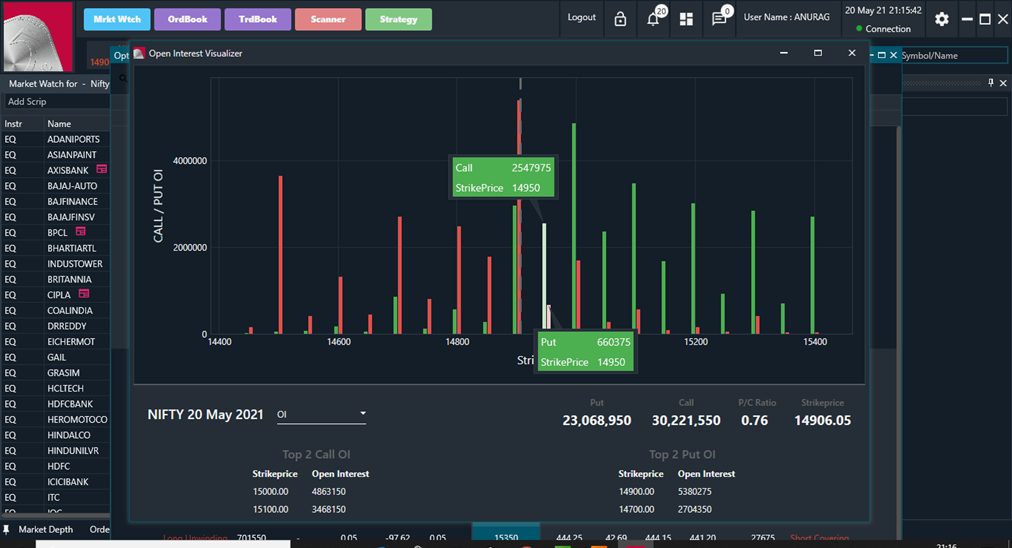
Option Chain & Open Interest
It shows the value of options which is categorized as ‘In the money’, ‘Out the money’ and ‘At the money’. It is calculated according to the spot price and it shows the above and below strike prices. The All-CTM Toggle allows to show only scrips which are close to Money.
Option Chain

A comprehensive option greek view along with live streaming. Buy/Sell, Add to WL directly from Option chain.
Option greek view

OI Watch shows the Rate, Performance, Percent OI Change and Open Interest value of the selected group. It also shows the performance of a particular scrip whether it is Long/Short Build up, Long/Short Unwinding.
OI Watch

Watch the OI data in the graphical form with the help of OI Analysis. You can view charts of OI, Change in OI, Change in OI %.
OI Analysis
Heat Map
Market watch can be toggled back and forth to Heat map. It shows the percentage change in a particular scrip by changing the colour from Dark to light i.e. (high %change to low % change).
Heat Maps

Widgets & Favorite Scrips
Widgets is helpful to track favourite stocks according to your preference. Also, user can directly place orders on clicking Buy and Sell. These widgets can be moved back and forth from favourite window to widget. Pinning the widget makes it stick on top of the screen.

Widgets

Market Depth
It shows the top 5 Bid/Offers, 52 Week High Low and other details of a particular scrip and can show both the NSE/BSE value on a single click. The scrip can also be added to the favourite scrip window by clicking on the star icon. It also shows the news for that day and shows all the news related to that scrip on expanding the market depth.

Pivot points
Before making a trade now quickly check pivot points.

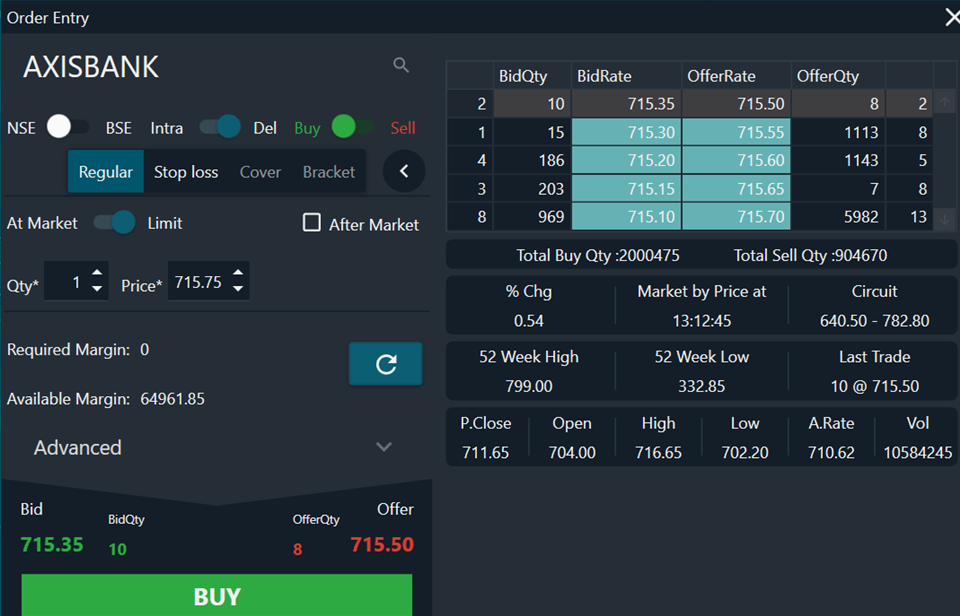
Order Placement
Tradestation has Order Entry window which shows OHLC, Previous close, Avg. rate and volume of the selected scrip along with 52 Weeks High/Low of the scrip. Use shortcut keys such as F1 for buy & F2 for Sell.
Once orders are placed, use F3 to check the order status. You can access this from bottom menu as well. It shows notification as well as messages for all the orders with ‘Red’ icon denoting Sell orders and ‘Green’ icon denoting ‘Buy’ Orders.
Order Window
Order Confirmation

Order Book

Holdings Dashboard
The Holdings Dashboard gives a visual representation of the current holdings.
Total Investment: It shows all your investments in a Pie chart to get a breakdown of investments in percentage.
Overall Profit/ Loss: It shows the top profit-making and loss bearing scrips in a bar graph format.
Absolute Gainers/ Losers: It shows the actual monetary profit/ loss for all the investments.
Percent Gainers/ Losers: It shows the profit/ loss in percentage terms.

Tradestation Scanner
It shows the results of Bullish, Bearish, Pivot Up/Down events like Gap Up, at High/Low of day, Yearly High/Low & Candlestick patterns too on REAL-TIME basis.
You can access it from the Top Menu – named Scanner. Click on events to filter the scans.

Condition Tracker
It will show the results of the various conditions like Open > Previous Open, Qty > 5000 etc. on selected group.


Options Strategy Builder
It shows Profit/Loss and trend of a particular scrip with different strike prices using pre-defined options strategies. After clicking on view in the result it displays pay of graph according to the strategy.

Easy Stock Search
The Search bar allows the user to quickly find stocks by using words like NSE, BSE, future, fut, opt, date, etc. Clicking on the stock opens the widget for the same and clicking on the + icon allows the user to add the stock to any of the opened market watch.

Theme
Tradestation has 4 in-built themes. User can set it according to their preference.

Topic Participants
Mrinmai Shinde
YAVANIKA
Rajput Akshita
Mihir@19
Mehul Jain