How to use Analyze Widgets?
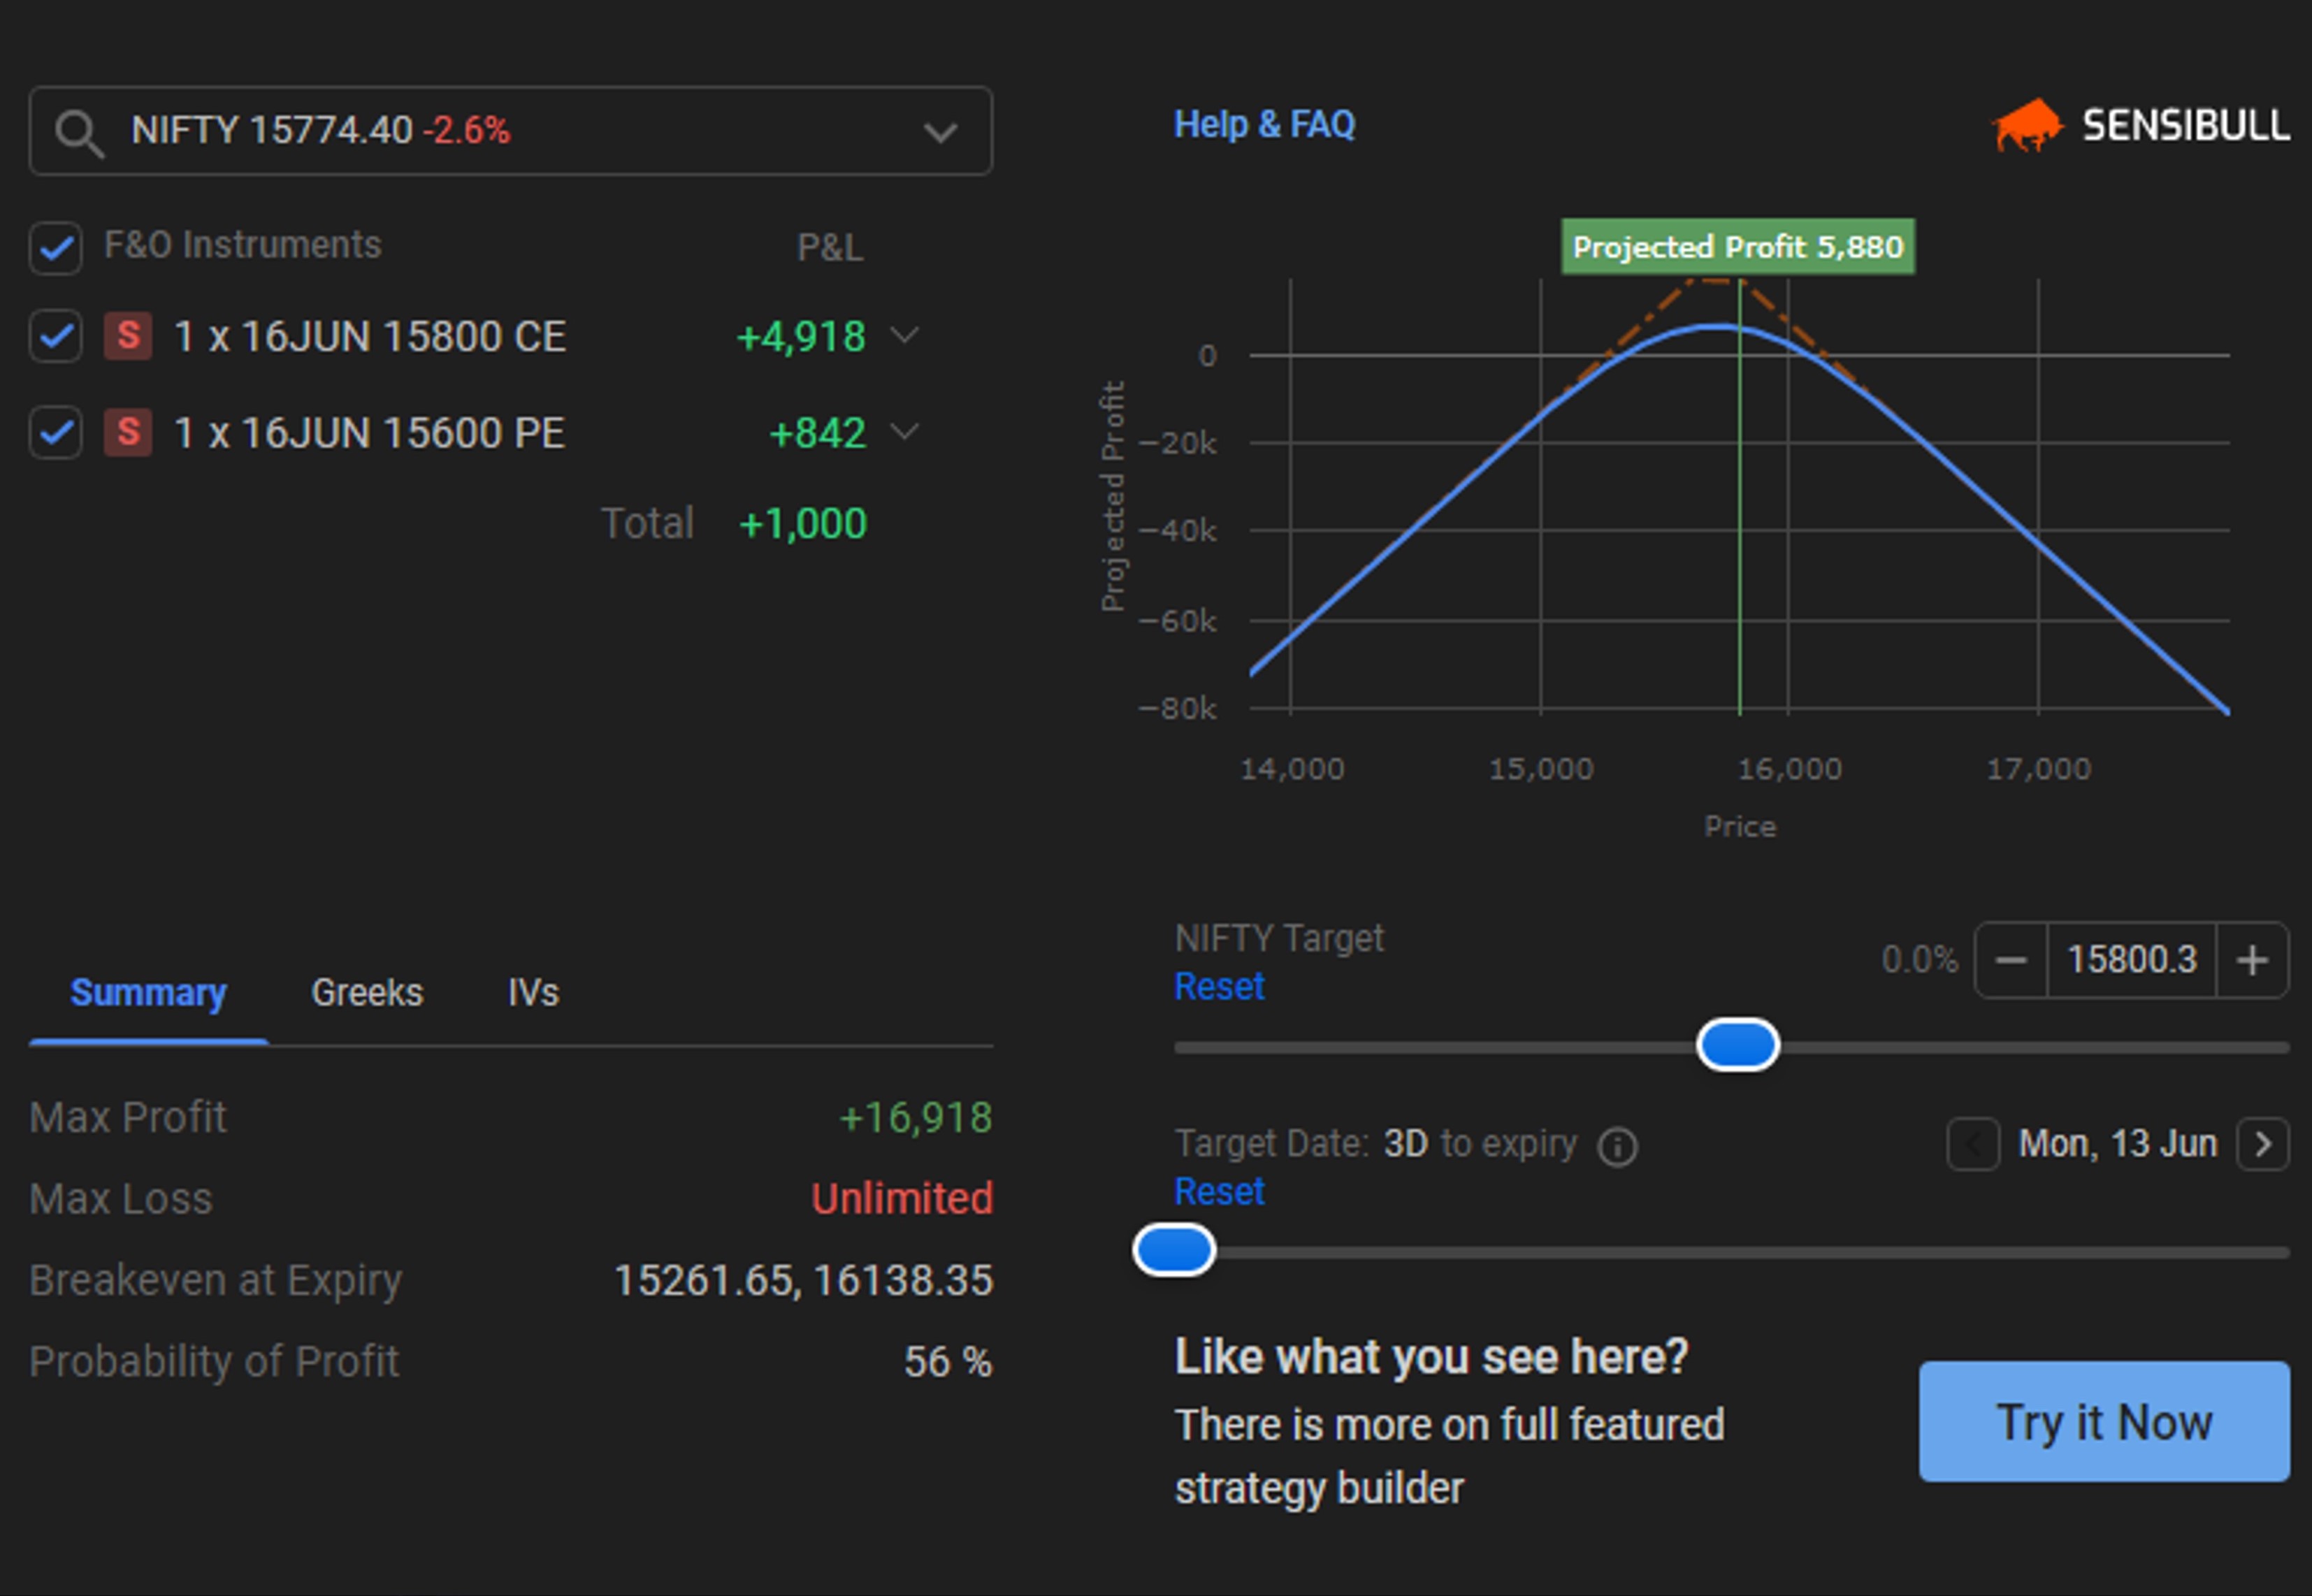
This feature helps you analyze the P&L of your F&O positions and basket orders. It tells you important numbers such as maximum profit, maximum loss, breakeven, and probability of your profit. It also tells your Option Greeks so that you can manage your risks accurately.
But here is the best part, it helps you to predict your P&L when an index or a stock moves to a particular price on a certain day. For example, you would have questions like:
- What would be my P&L if the market goes up or down 2% tomorrow?
- What would I gain or lose if the market stays flat after an event?
- If I buy some options on a Friday, how much will I lose if the market opens flat?
You can answer these questions with this tool by moving the target and date sliders on the widget.
If you have any active F&O in your account an analyze icon will appear in the positions tab.
On clicking the button a pop-up will appear where real-time analytics with respect to your live positions would be provided. With this, you can check the following data for your active positions:
- Payoff chart of strategy active
- Greeks break up along with net greeks.
- Strategy break-even points
- Probability of Profit
And many more data points for analysis. Further, on how to use the F&O calculator, refer here.
To Activate the F&O segment, click here.
Topic Participants
Roopsi Gupta
LALABHAIHANDSGAM
DSHOVAN39
HEMBROMMEHENDRA54
MAMTAHBARIA