Why Open Interest Graphs are useful?
Watch the OI data in graphical form with the help of OI analysis. You can view charts of OI, change in OI, and change in OI percentage.
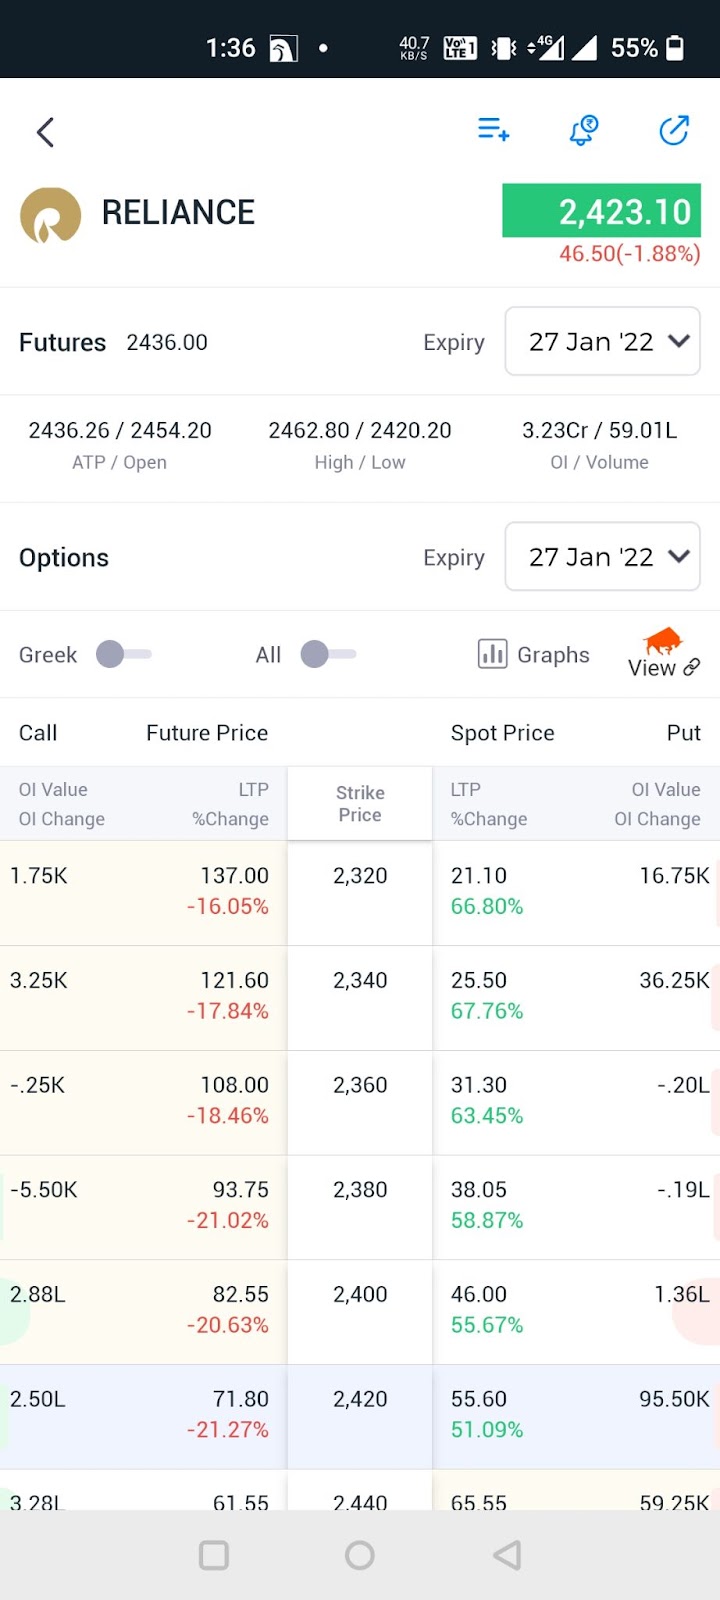
For doing so you can click on the graph button from the options chain as shown below-
You will see the following 3 graphs on this page-

These graphs will help you to understand quickly that on which strike price the open interest is high/low. Apart from watching the OI graph analysis, now you can analyze the profit or loss of your F&O positions through the use of widgets. For more details on how to use the widget, tap here.
If you're an extensive trader, you may like to watch out for how the developer's APIs work and give you access to market prices, executed order details, positions, and other things in real-time.
Download the app now, click here
To activate the F&O segment, click here.
Also, click here and have a trading experience like never before on our web portal.
Topic Participants
Roopsi Gupta